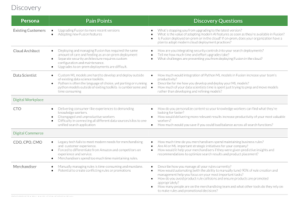
Challenge
When a new CRO came into the company, they were looking for one place to understand the health of their business.
- Data was spread across system specific dashboards including Salesforce, Marketo, Gainsight, Outreach, Netsuite and others.
- Meetings were disrupted with anecdotal data pulled from unsanctioned reports
- Executives lacked consistent visibility into key Revenue metrics
Solution
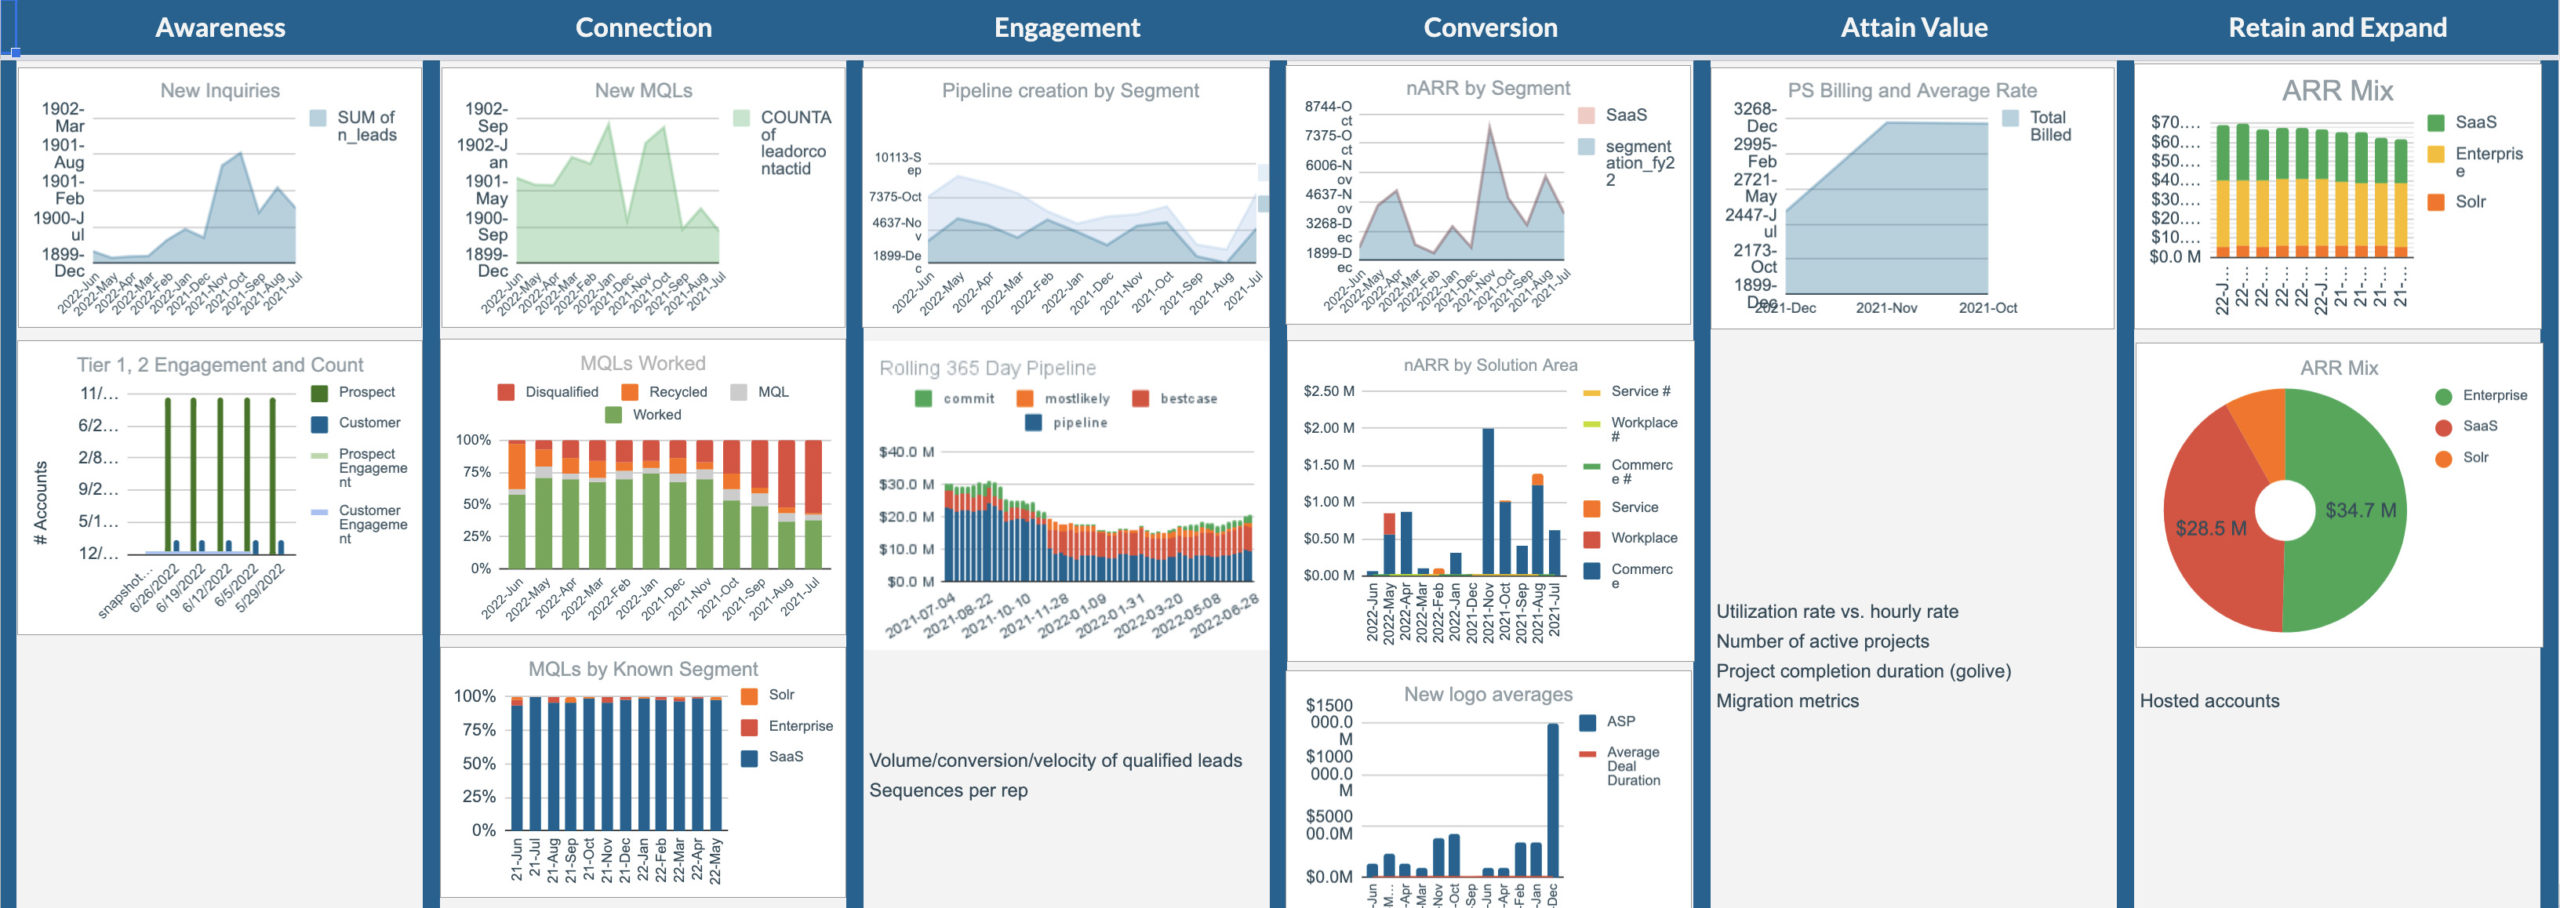
Analytics Framework
Rather than define reports solely for internal departments, we looked at defining clear customer engagement handoffs. This yielded a 6 stage lifecycle model that had clear customer and internal hand off points (ACECARE):
- Awareness: how much first time interest is detected through inquiries, this measured marketing effectiveness at exposing more ideal customers to the compaany’s solutions
- Connection: how many prospects “raised the hand” to connect with the company to learn more. This measures product marketing effectivess
- Engagement: How effective are our efforts to communicate the value of the solution such that the prospect enters a buying cycle by confirming budget access through identification of the economic buyer and identified pain. This measures sales/business development team effectiveness.
- Conversion: Once in the buying cycle how quickly and effectively can we close deals that deliver revenue. Here we look at the sales team effectiveness
- Attain Value: How quickly does the customer get to value by implementing the solution. In services heavy solution this may look at PS effectiveness, in more self-service environment, customer success and TAM effectivess is measured.
- Retain and Expand: Net retention is the easiest way to grow revenue, here we look at at-bat, gross and net retention metrics to evaluate CS effectiveness as well as product fit and product portfolio richness.
In defining metrics we also look at the types of metrics to be evaluated. They fall into the $#%T (Shoot) framework.
| $ (revenue) | # (volume) | % (conversion) | T (time/velocity) |
|---|---|---|---|
| In later stages of the ACECARE framework, how much value can we place on a given flow. Pipeline value, deal close amounts, ASPs, Total ARR | Volume metrics are more key earlier in the cycle. Prospects, Leads, Opportunities, Customers. | Effectiveness of processes and messaging impacts the conversion rates from leads to opps, or opportunity close rate. | How quickly prospects move through the revenue lifecycle. Reducing qualification time or accelerating deal velocity can yield huge benefits with all other metrics remaining equal. |

Data Warehouse Architecture
Consistent data warehouse: Implemented a Google BigQuery data warehouse and used Stitch to pipe salesforce, marketo and other system data. This also includes thinking about how different resources will use the data and federating consistent data and making views available for self service.
Common Views: Working with my data analyst we built common views written in SQL that pulled together exported table data. This ensured that legacy data fields and confusingly labeled data were ignored and could be updated as standard fields evolved. Some queries joined tables from multiple data sources.
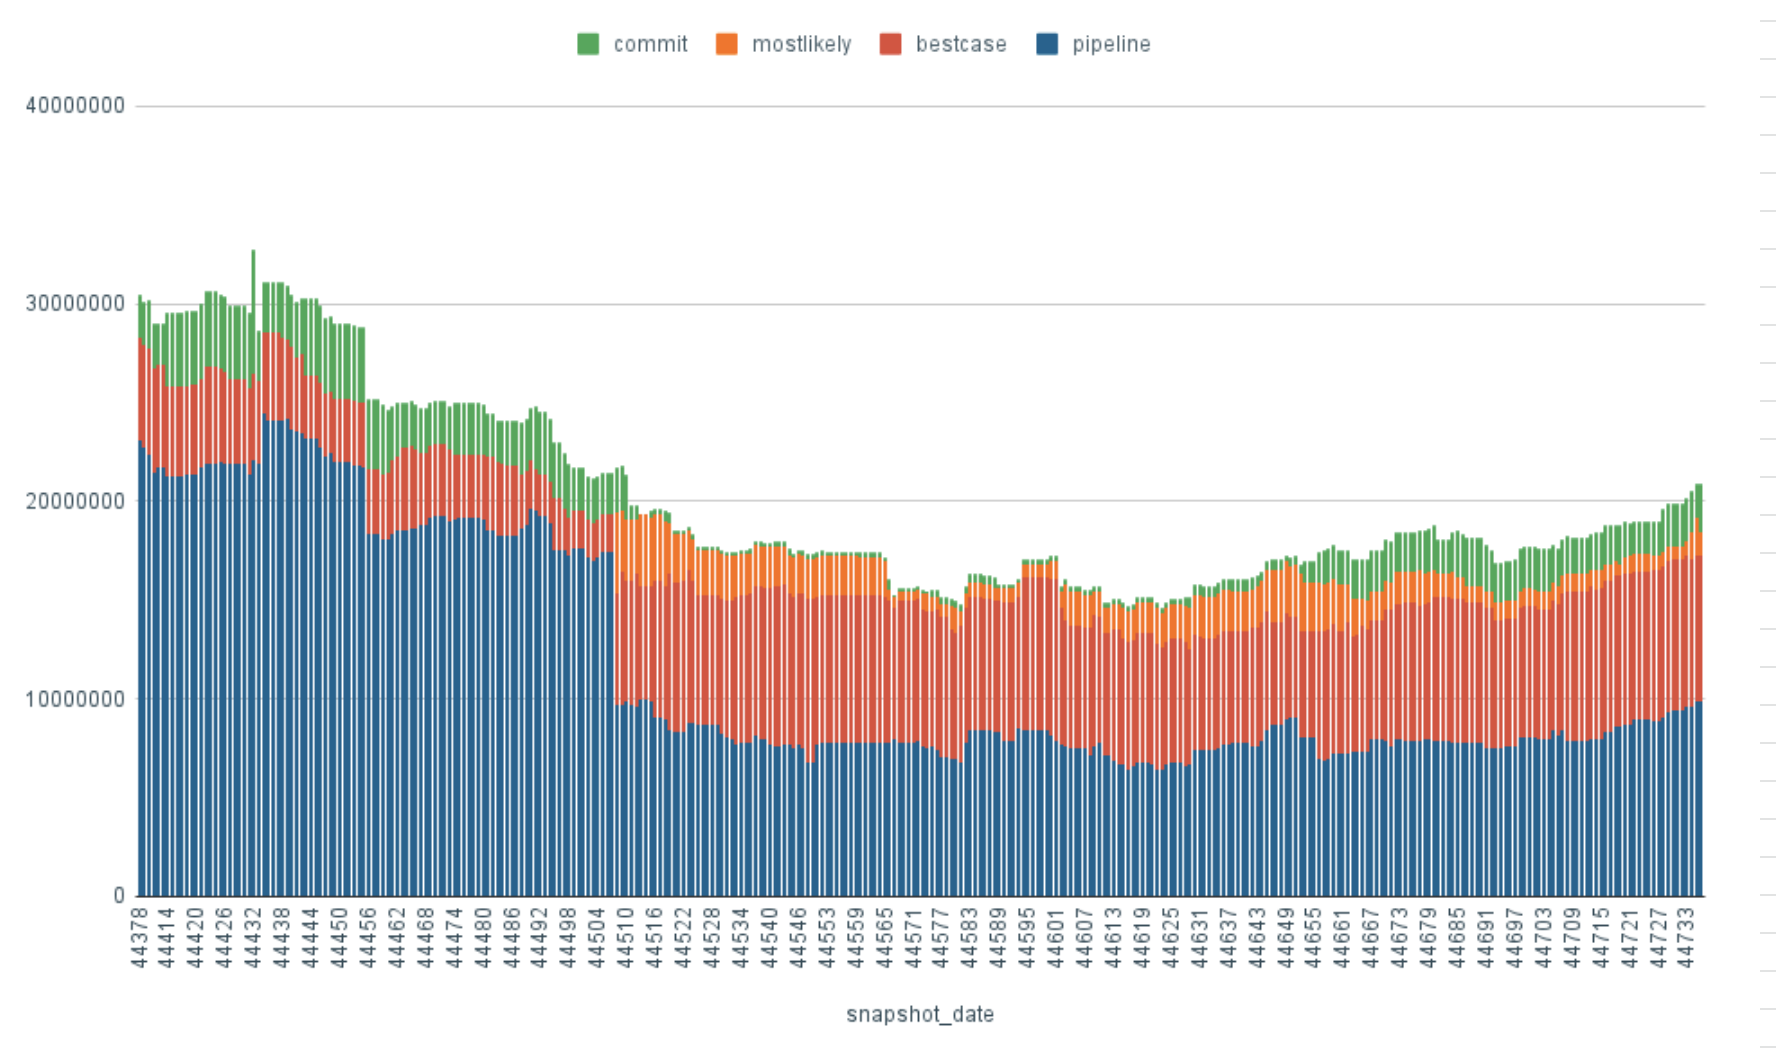
Snapshots: for consistent historical perspective, daily snapshots were taken of key data (leads, opportunities, accounts) to allow for clearer comparison over time and track things like forecast accuracy over time.
Vizualization
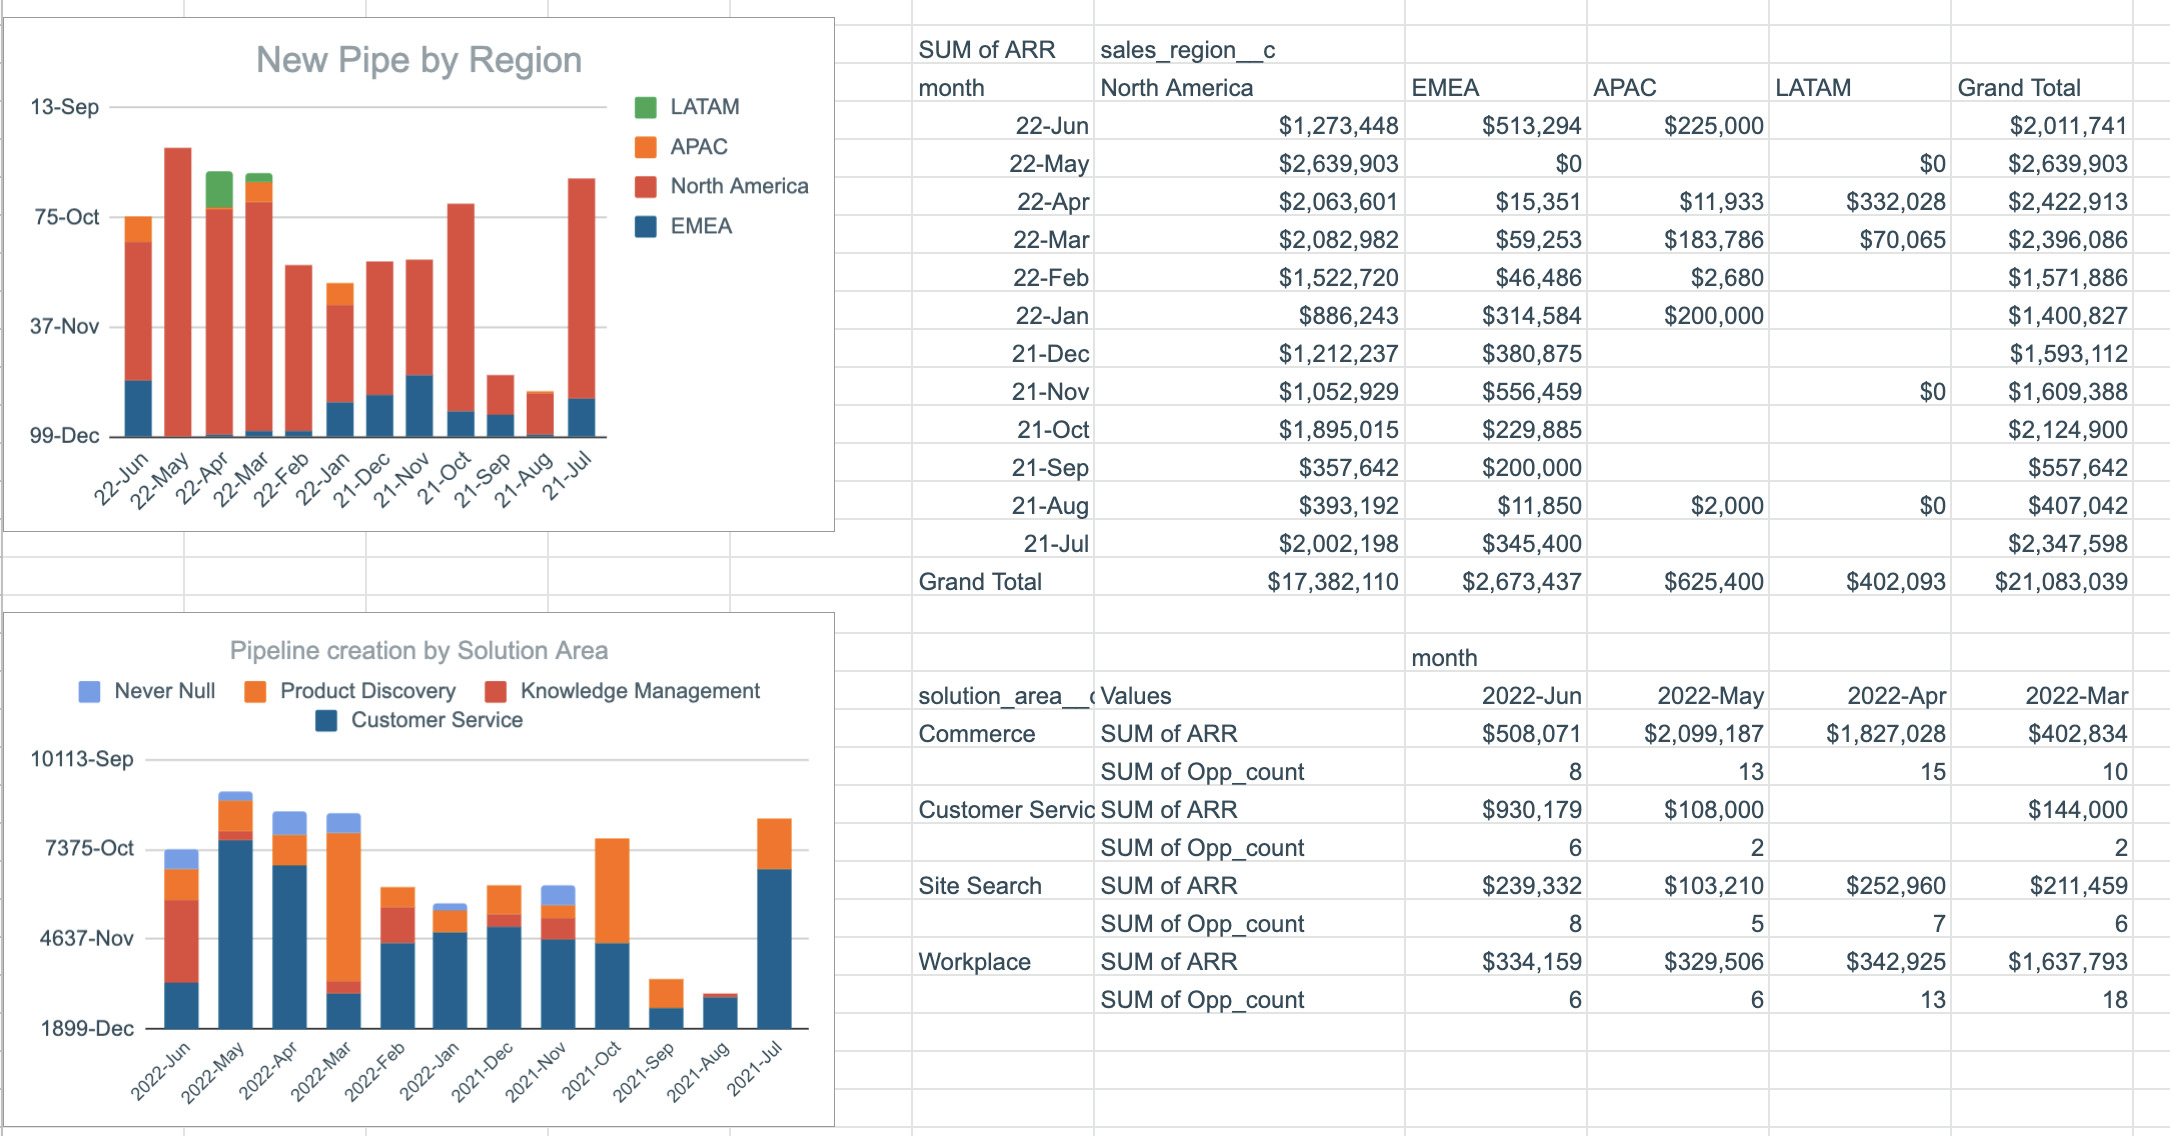
Data aggregation turned into insight through charts to display the $#%T metrics in useful ways to show important changes over time at each stage in the revenue engagement lifecycle.
Additional pages show more detailed charting and data for more in-depth analysis and to provide forensics and sourcing information